 Have you ever thought about the type of customer feedback you could draw from a Net Promoter Score (NPS) survey, or wondered what a good NPS should look like? If so, The Zendesk Customer Service Benchmark Report is sure to have the answers you’re looking for.
This report is based on actual customer service interactions from more than 25,000 companies, across 140 countries. It measures key metrics around customer self-service, customer support, and customer engagement.
It also shows some interesting metrics in comparing NPS surveys to customer satisfaction surveys. Although a customer satisfaction survey is typically sent to customers who have recently contacted a company (whereas NPS is sent to a broader sample), the overall comment rate for NPS surveys is almost twice that of customer satisfaction surveys (even though response rates for NPS are half of satisfaction surveys). As we all know, this translates into valuable feedback for companies!
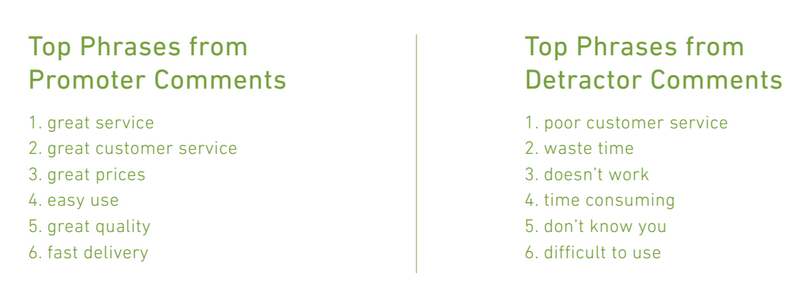
The analysis highlighted the importance of the customer experience and its effect on overall brand perception (shown below). Promoters are those who gave a rating between 9-10 and detractors are those who gave a rating between 0-6.

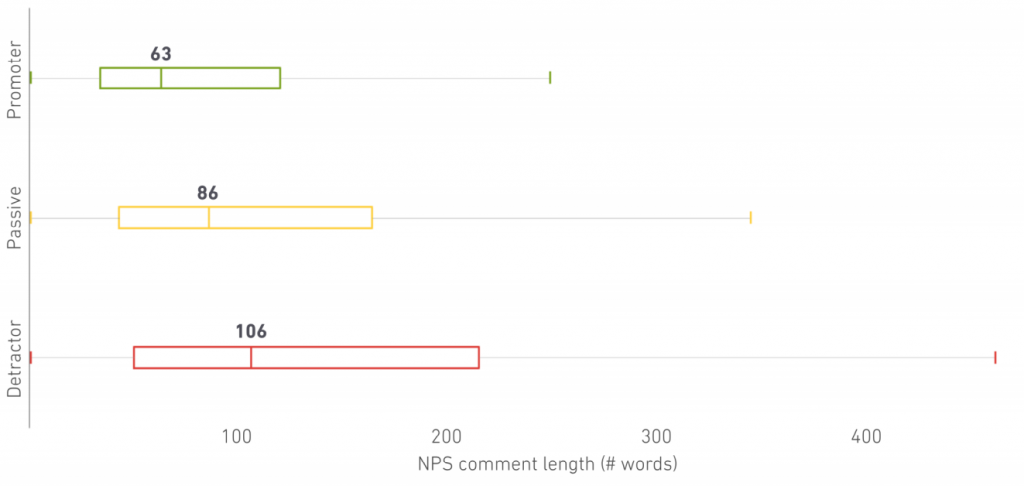
Companies get a ton of value from open-ended feedback in comparison to multiple choice responses, and detractors are more likely to provide that feedback in detail. The chart below illustrates that they in fact leave the longest comments.

Interested in getting your hands on this report? Click here to access the full article for your reading pleasure!
Whitepaper: The Executive Guide to Improving 6 Call Center Metrics
Your call center operates in a stressful environment where good quality metrics lead to a higher standard of customer service.
Download our free guide to help you improve 6 key call center metrics for better performance and future success.
What’s Inside:
- Customer Satisfaction
- Service Level
- First Call Resolution
- Average Handle Time
- Plus so Much More!
DOWNLOAD THE FREE 8 PAGE REPORT TODAY

